Process Overview
Data Preparation
- Split the 1.6M NF-UNSW-NB15 records into 2:1:1 train/val/test.
- Normalized numeric fields & dropped raw IPs to prevent leakage.
- Tested four pipeline versions: raw_all_features, ip_octets_and_freqs, subnet_freqs_only, no_ip_raw_numeric.
Model Optimization
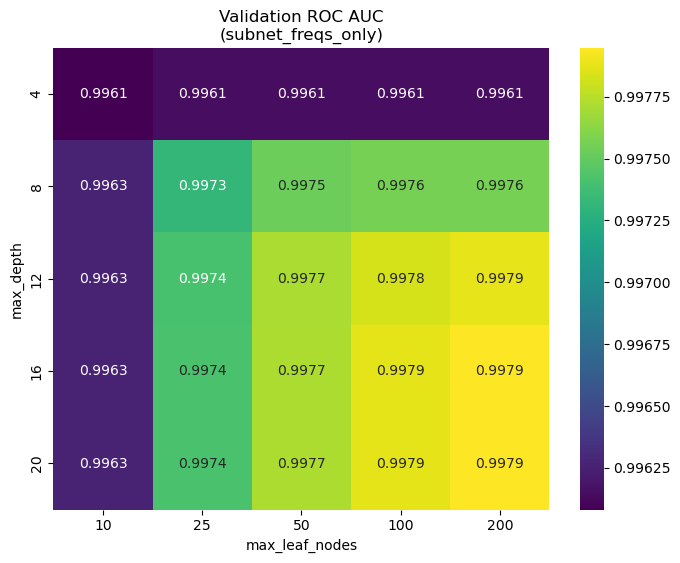
Ran Random Forest sweeps on max_depth, max_leaf_nodes, and min_samples_leaf, visualizing ROC-AUC heatmaps to locate stable hyperparameter regions that maximize performance without overfitting. (Manual tuning + limited grid search due to compute constraints.)
Feature Version Performance
4 pipelines for data-processing regarding IP addresses were tested on: Accuracy, Macro-F1, and ROC-AUC.
- raw_all_features: Baseline using every numeric column
- ip_octets_and_freqs: IP → octets + frequency counts
- subnet_freqs_only: Aggregated /24-subnet flow frequency
- no_ip_raw_numeric: Numeric fields only, no IP info
Although ip_octets_and_freqs led in ROC-AUC; subnet_freqs_only matched closely with fewer features, reducing overfitting risk.
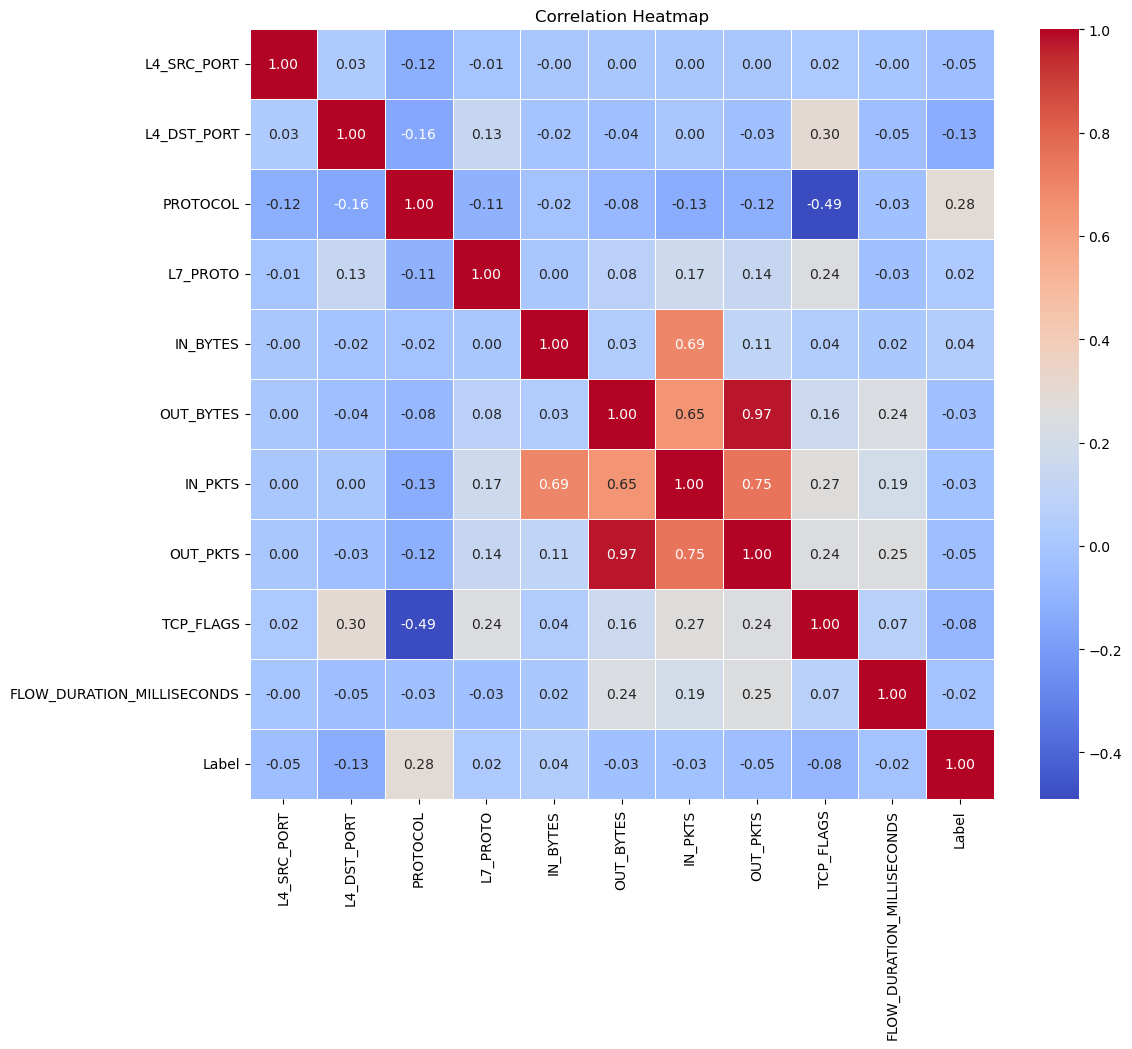
Correlation Heatmap
OUT_BYTES vs OUT_PKTS correlation >0.95; dropped OUT_BYTES removed redundancy without loss.
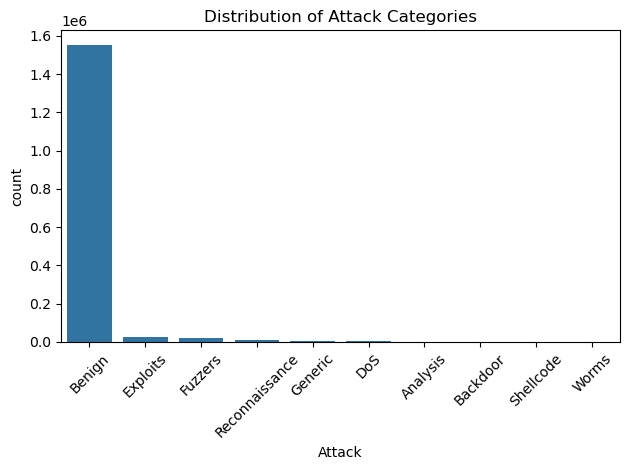
Distribution Plots
Heavy-tailed IN_BYTES & FLOW_DURATION_MILLISECONDS; log transforms improved rare-class recall by ~3 points.
Leaf-Count vs AUC
Peak AUC 0.997 at 100 leaves & depth 12, yielding the final hyperparameter choice.
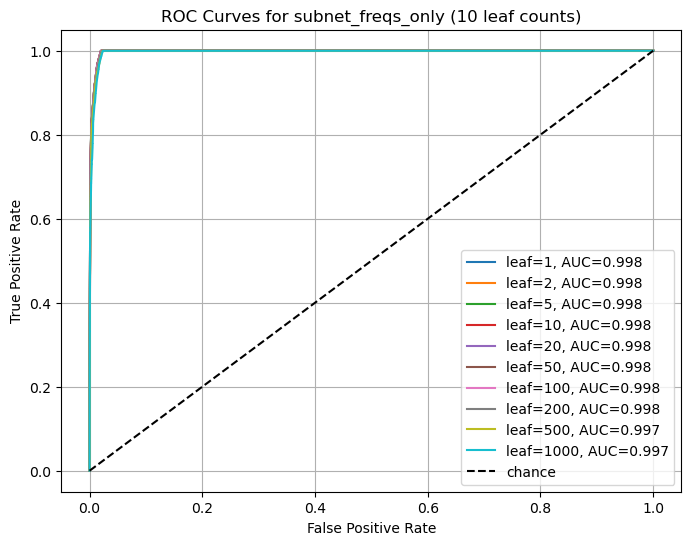
ROC Curves
ROC curves for various max_leaf_nodes settings on the subnet_freqs_only variant.
Final Model & Testing Metrics
Hyperparameters
RandomForestClassifier(
  n_estimators=200,
  max_depth=12,
  max_leaf_nodes=200,
  min_samples_leaf=100,
  n_jobs=-1,
  random_state=42
)
Test Results
Accuracy:   0.9889
ROC-AUC:    0.9978

Classification Report:
             precision    recall  f1-score   support
0            0.9941    0.9942    0.9942    387678
1            0.8760    0.8737    0.8749     18102

accuracy                        0.9889    405780
macro avg    0.9351    0.9340    0.9345    405780
weighted avg 0.9888    0.9889    0.9888    405780
Strong overall performance. Lower recall on attacks suggests up-sampling or down-sampling strategies to improve detection.